Antv-X6图编辑器的应用——流程图实现
demo图
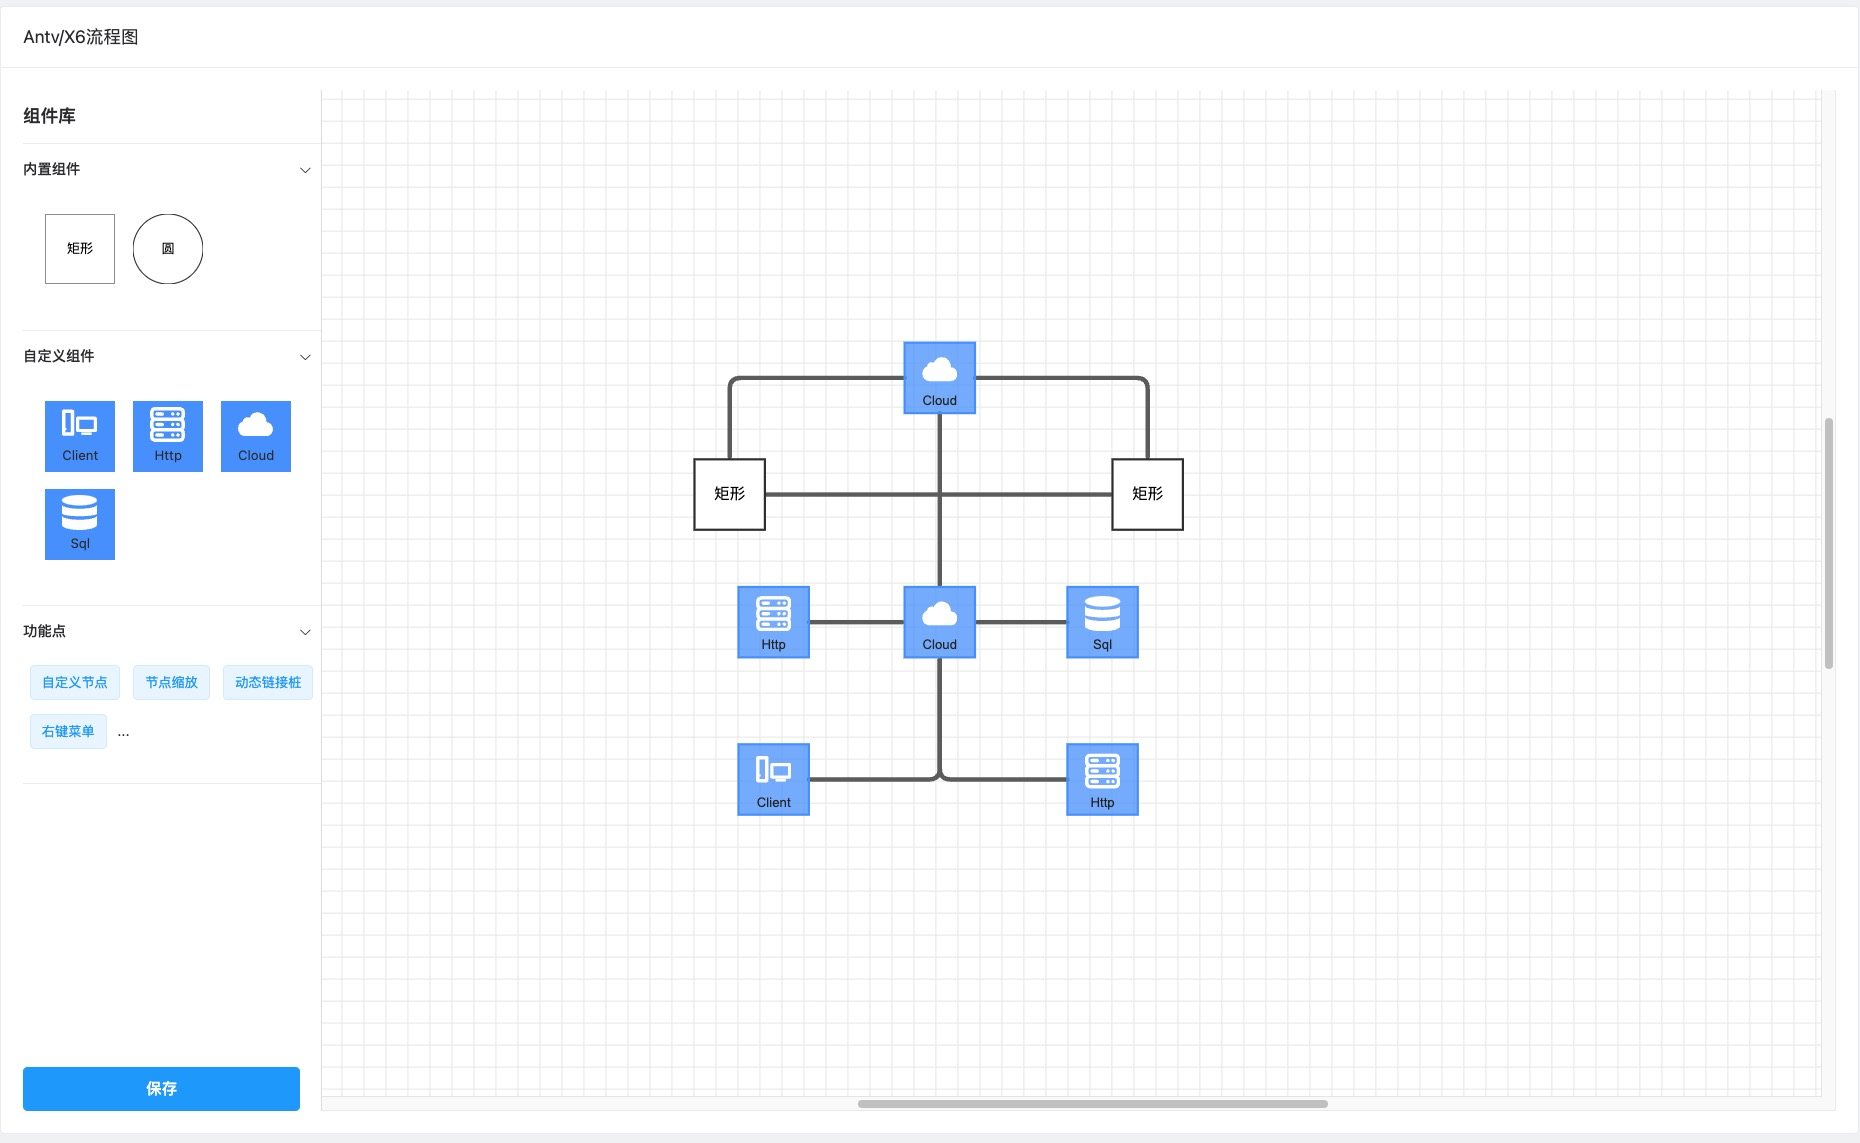
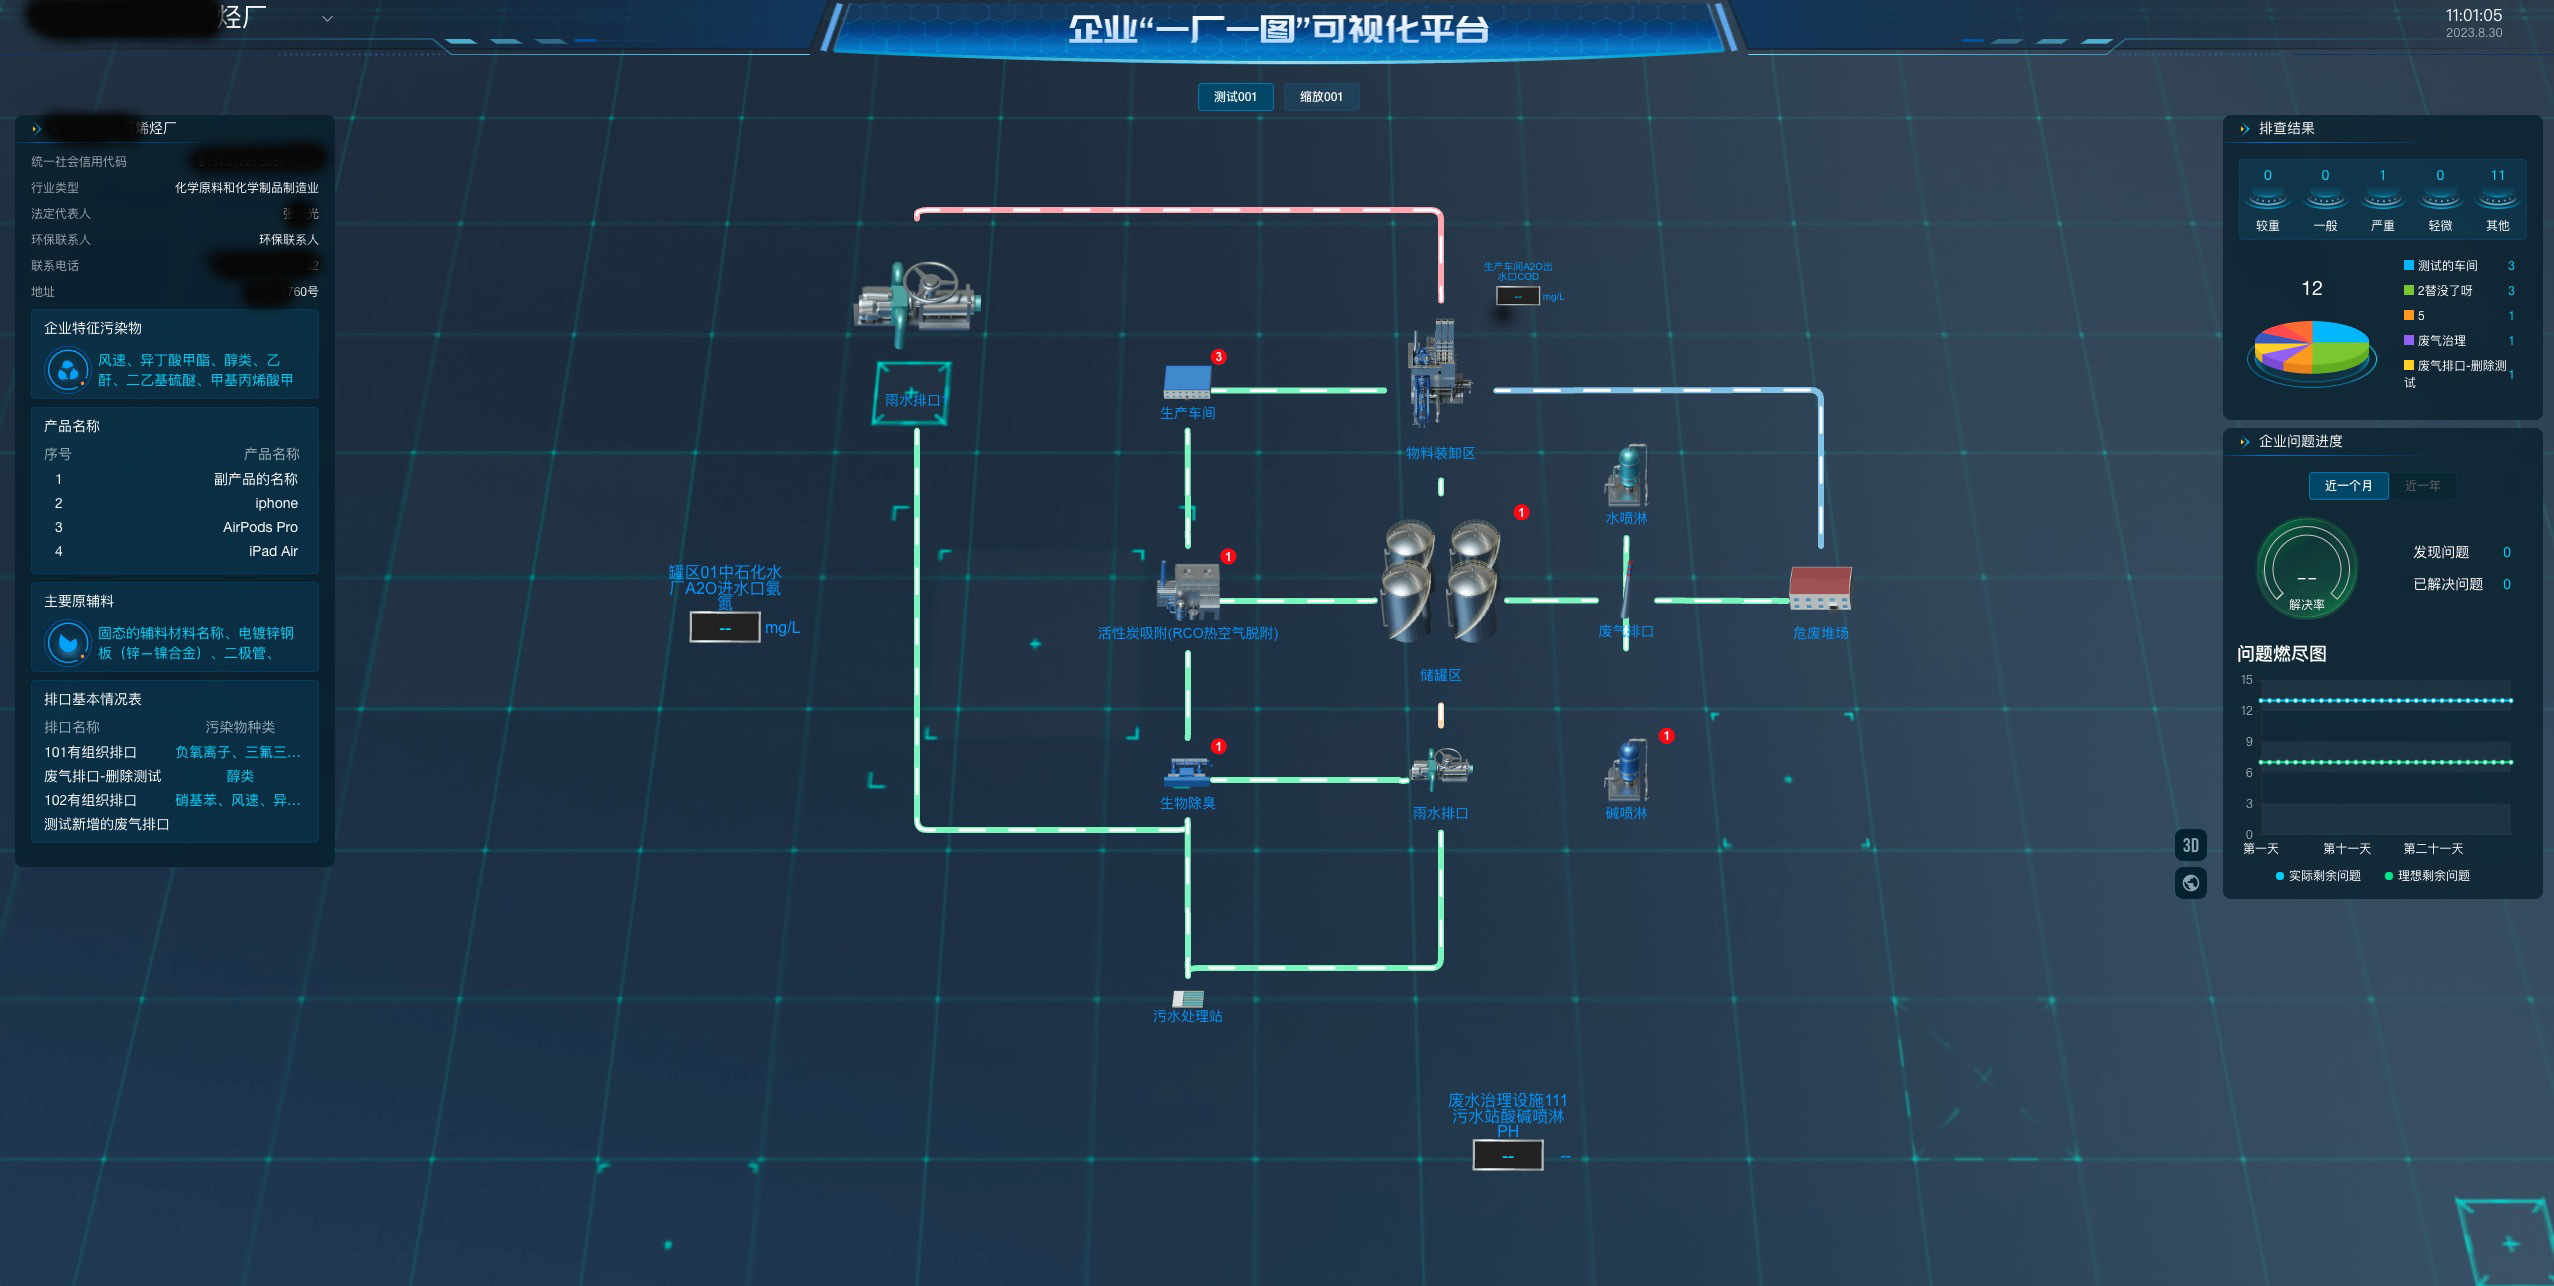
项目效果展示
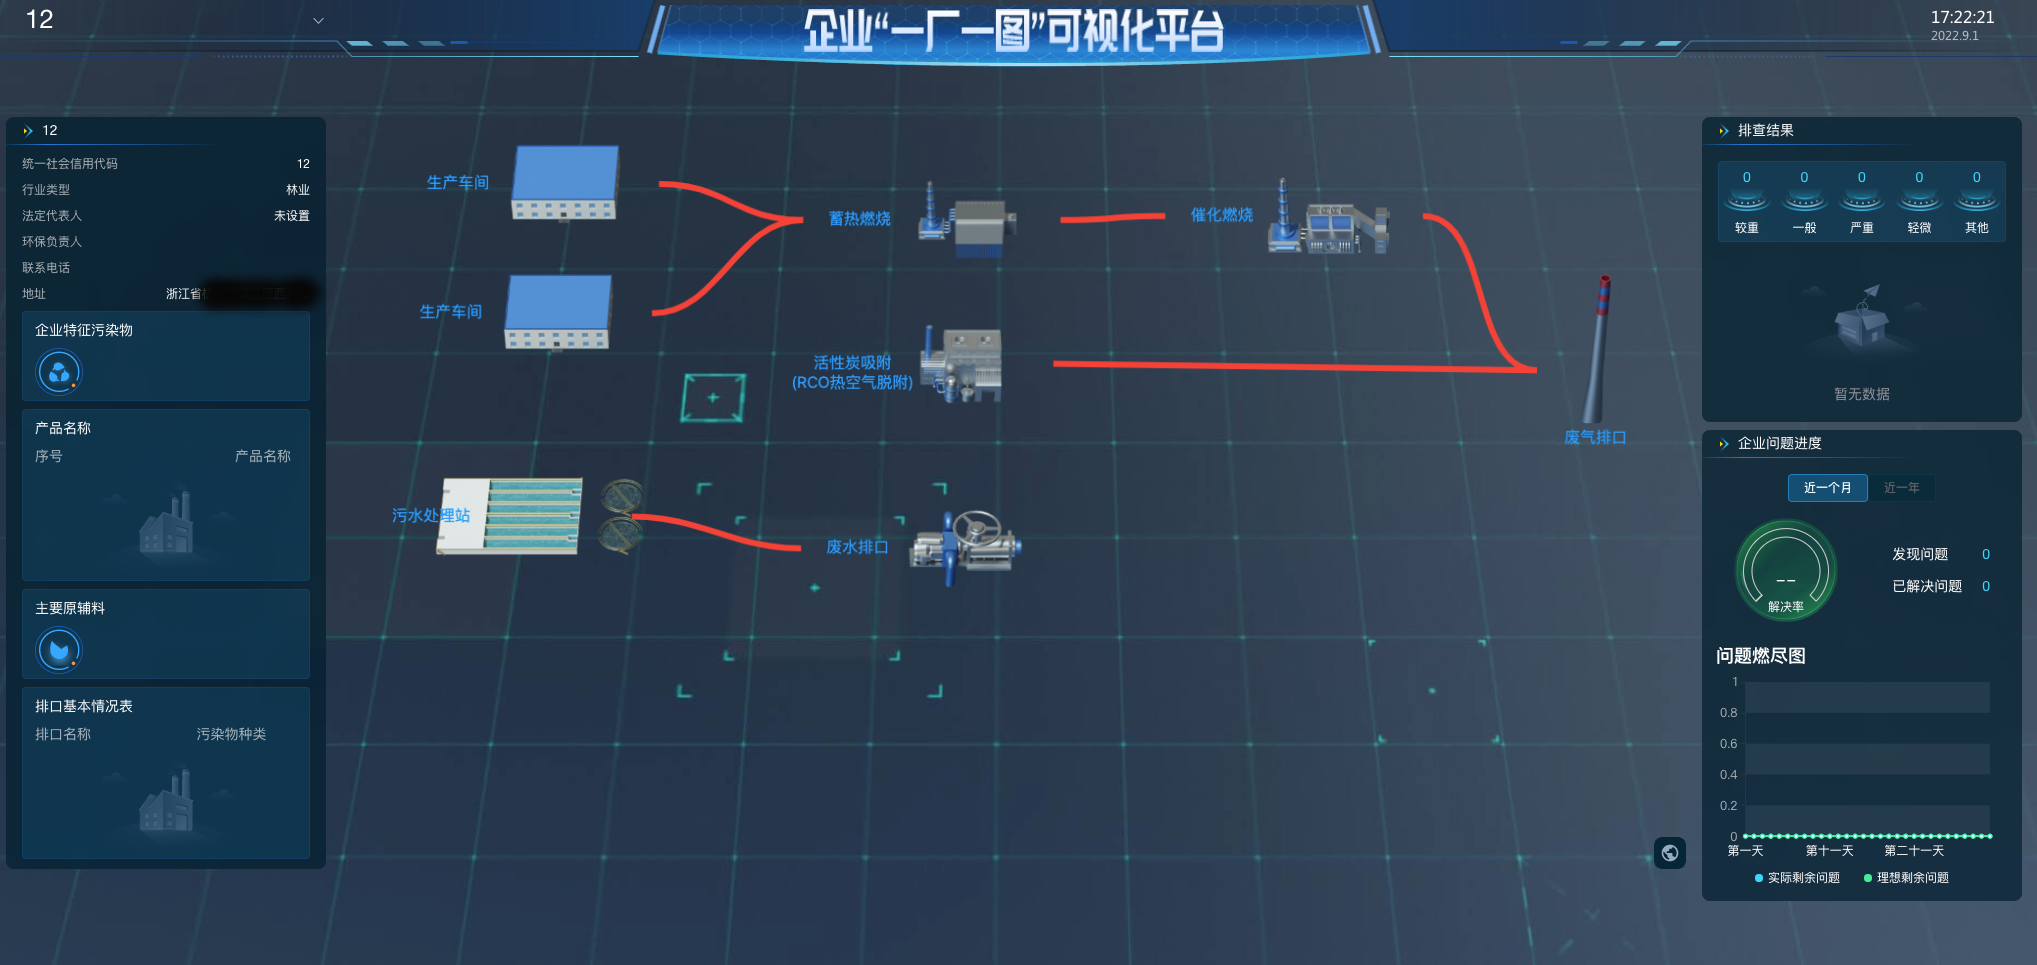
旧版
UI图
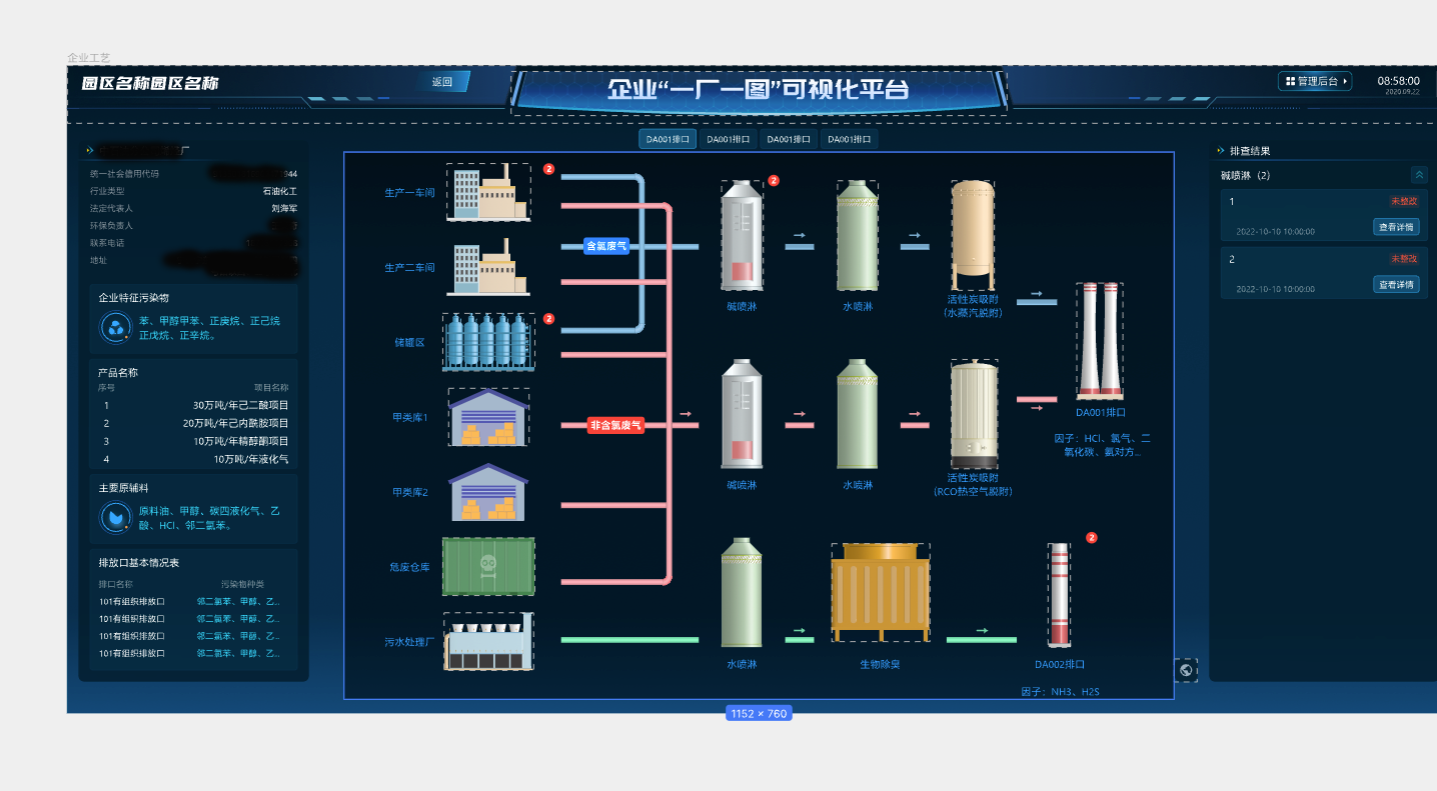
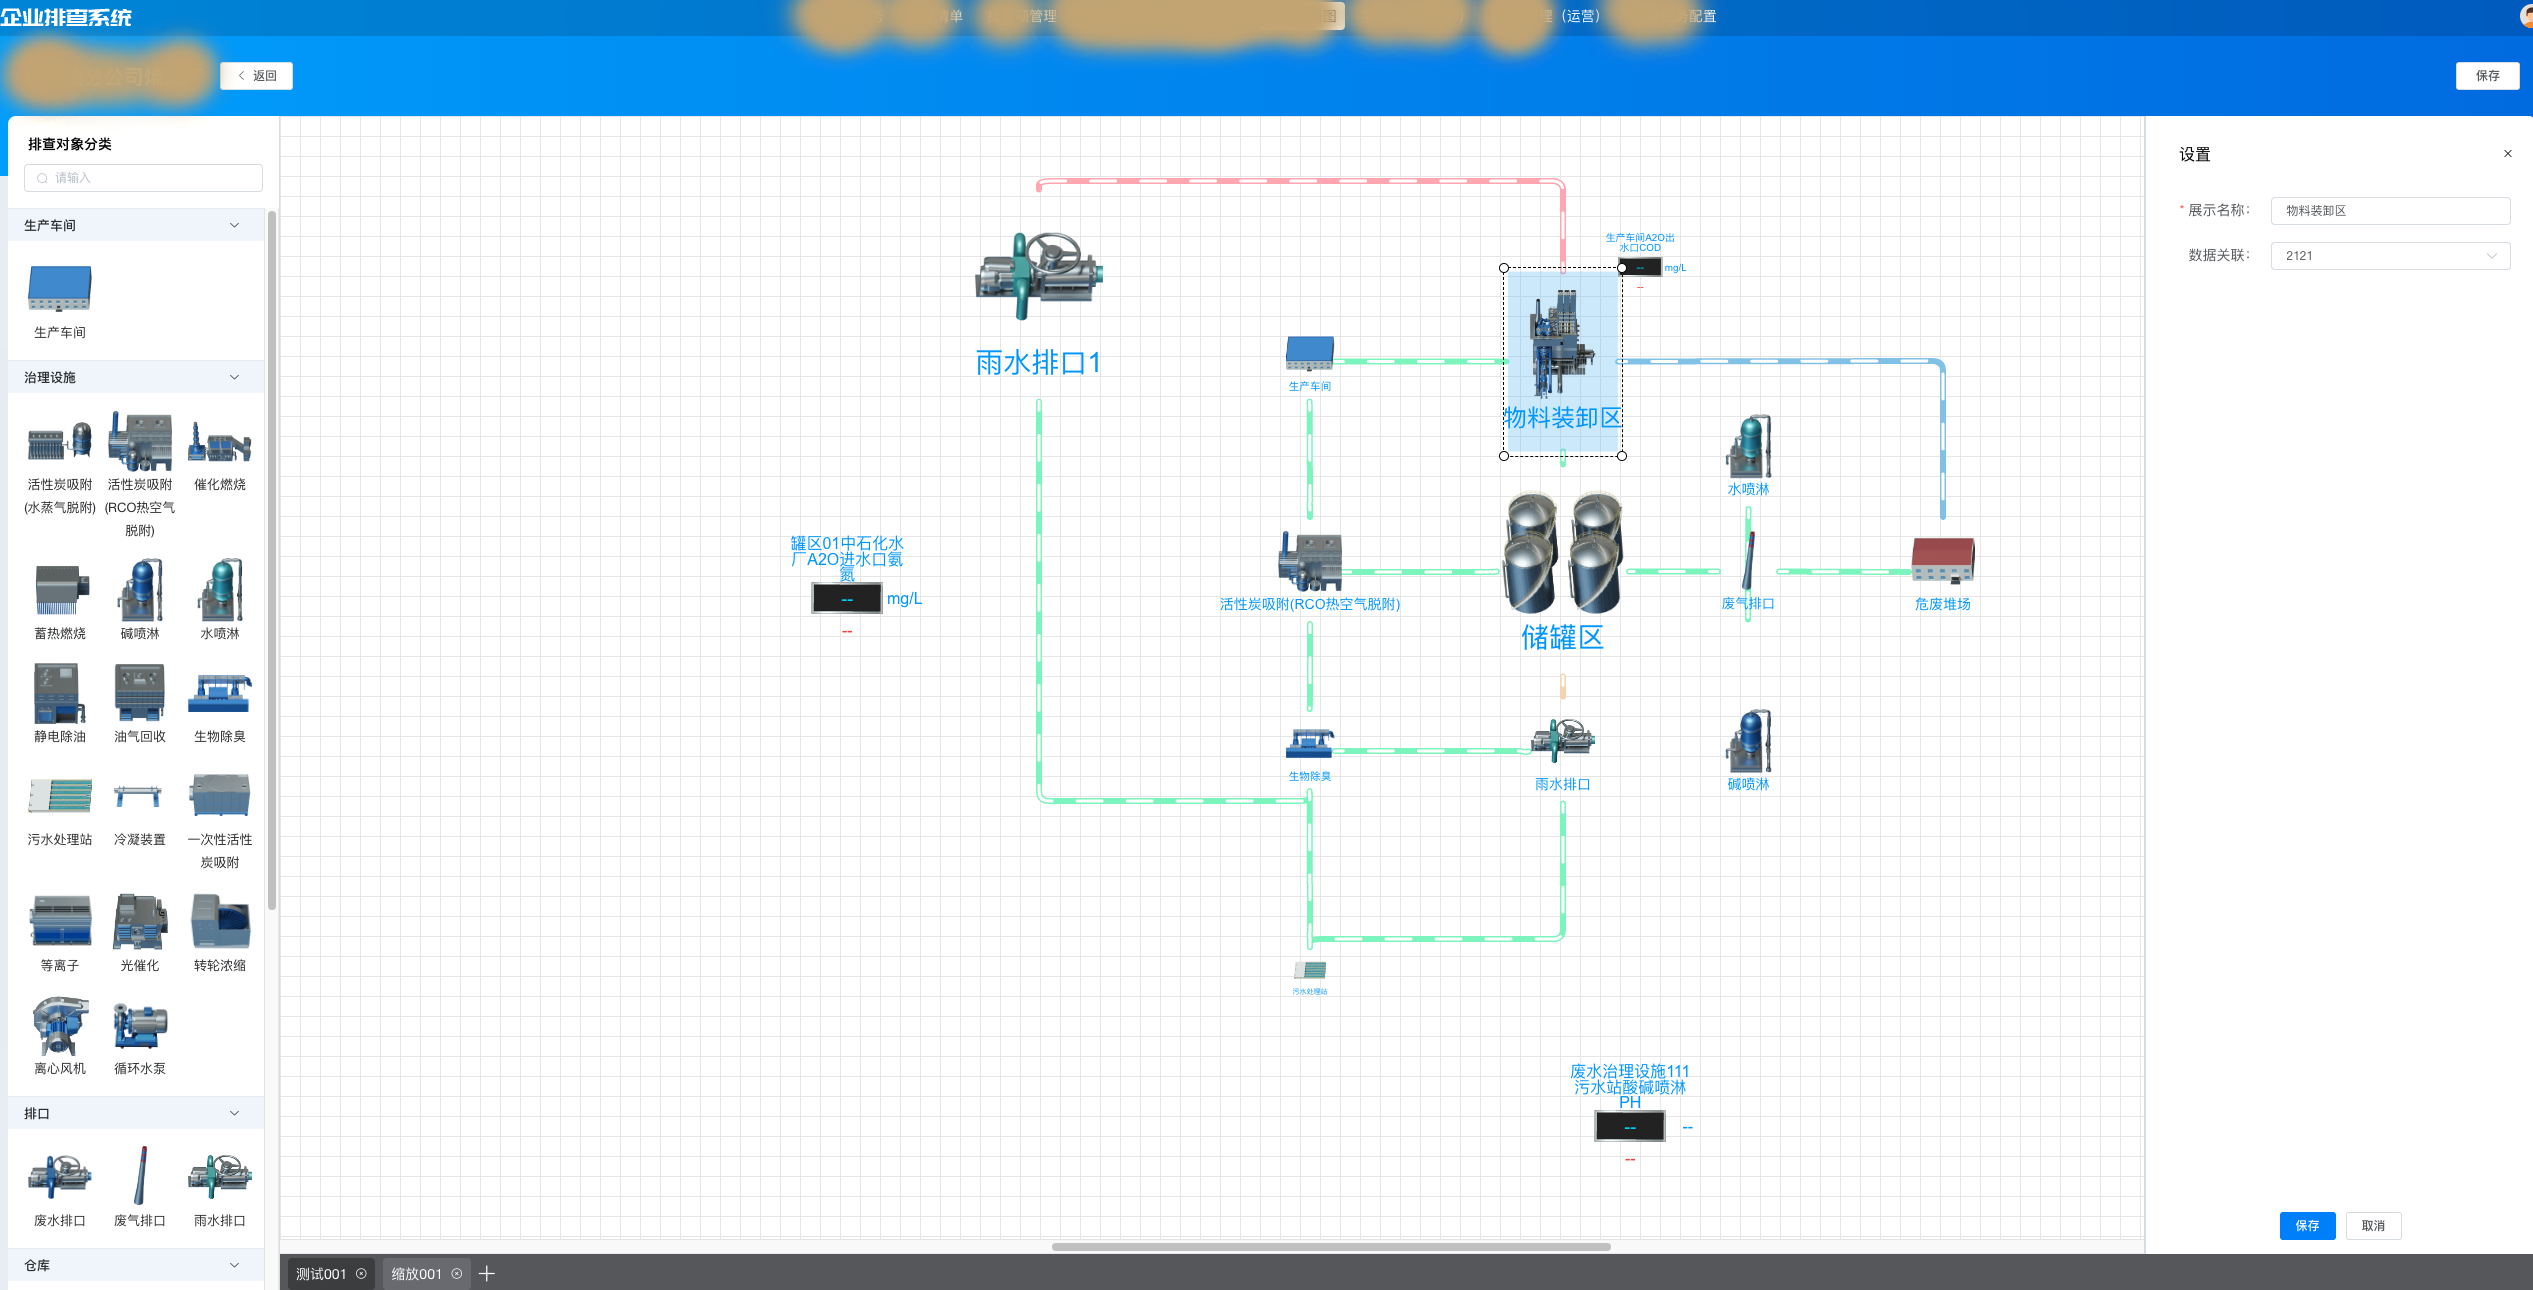
项目效果
- 编辑端
- 地图端
SVG介绍

因为antv/x6是基于SVG的图编辑器,所以SVG的知识有必要了解下的
简介
- 可缩放矢量图形【基于图形】
全称:Scalable Vector Graphics
- 定义基于矢量的图形
- 基于XML语法
- 放大缩小不会失真
- 属于万维网标准
- 可以插入DOM,通过JavaScript和CSS来操作
语法
<svg width=“200” height=“200” viewBox=“-100 -100 200 200”>
  	<polygon points="0,0 80,120 -80,120" fill="#234236" />
    <polygon points="0,-40 60,60 -60,60" fill="#0C5C4C" />
    <polygon points="0,-80 40,0 -40,0" fill="#38755B" />
    <rect x="-20" y="120" width="40" height="30" fill="brown" />
</svg>
<!– viewBox:视口开始位置 -->
<svg>的width属性和height属性,指定了 SVG 图像在 HTML 元素中所占据的宽度和高度。<viewBox>属性的值有四个数字,分别是左上角的横坐标和纵坐标、视口的宽度和高度。
形状标签
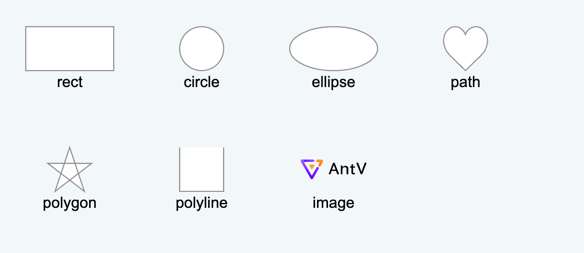
常用的基本形状,也是我们常用的标签
● 矩形 <rect>
● 圆形 <circle>
● 椭圆 <ellipse>
● 线 <line>
● 折线 <polyline>
● 多边形 <polygon>
● 路径 <path>属性
通过属性可以去修改SVG的一些样式
.red {
  fill: red;
}

.fancy {
  fill: none;
  stroke: black;
  stroke-width: 3px;
}SVG 的 CSS 属性与网页元素有所不同,主要的属性如下:
fill:填充色
stroke:描边色
stroke-width:边框宽度Antv/X6介绍

Antv:蚂蚁集团数据可视化团队
简介
X6:基于 HTML和 SVG的图编辑引擎,X6 是 AntV旗下的图编辑引擎,提供了一系列开箱即用的交互组件和简单易用的节点定制能力,方便我们快速搭建 DAG 图、ER 图、流程图等应用。
图编辑核心能力:节点、连线与画布
使用
Step 1 创建容器
在页面中创建一个用于容纳 X6 绘图的容器,可以是一个 div 标签。
<div id="container"></div>Step 2 准备数据
X6 支持 JSON 格式数据,该对象中需要有节点 nodes 和边 edges 字段,分别用数组表示:
const data = {
  // 节点
  nodes: [
    {
      id: 'node1', // String,可选,节点的唯一标识
      x: 40,       // Number,必选,节点位置的 x 值
      y: 40,       // Number,必选,节点位置的 y 值
      width: 80,   // Number,可选,节点大小的 width 值
      height: 40,  // Number,可选,节点大小的 height 值
      label: 'hello', // String,节点标签
    },
    {
      id: 'node2', // String,节点的唯一标识
      x: 160,      // Number,必选,节点位置的 x 值
      y: 180,      // Number,必选,节点位置的 y 值
      width: 80,   // Number,可选,节点大小的 width 值
      height: 40,  // Number,可选,节点大小的 height 值
      label: 'world', // String,节点标签
    },
  ],
  // 边
  edges: [
    {
      source: 'node1', // String,必须,起始节点 id
      target: 'node2', // String,必须,目标节点 id
    },
  ],
};Step 3 渲染画布
首先,我们需要创建一个 Graph 对象,并为其指定一个页面上的绘图容器,通常也会指定画布的大小。
import { Graph } from '@antv/x6';

const graph = new Graph({
  container: document.getElementById('container'),
  width: 800,
  height: 600,
});

// 读取数据
graph.fromJSON(data)画布 Graph
https://x6.antv.vision/zh/docs/tutorial/basic/graph
图的载体,包含了所有元素、渲染及交互。
新建画布
let graph = new Graph(graphOptions())基类 Cell
https://x6.antv.vision/zh/docs/tutorial/basic/cell
图形共同的基类 ,定义了节点和的边共同属性和方法
                                 ┌──────────────────┐
                             ┌──▶│ Shape.Rect       │
                             │   └──────────────────┘
                             │   ┌──────────────────┐
                             ├──▶│ Shape.Circle     │
                 ┌────────┐  │   └──────────────────┘
              ┌─▶│  Node  │──┤   ┌──────────────────┐
              │  └────────┘  ├──▶│ Shape.Ellipse    │
              │              │   └──────────────────┘
              │              │   ┌──────────────────┐
              │              └──▶│ Shape.Xxx...     │
  ┌────────┐  │                  └──────────────────┘
  │  Cell  │──┤
  └────────┘  │                  ┌──────────────────┐
              │              ┌──▶│ Shape.Edge       │
              │              │   └──────────────────┘
              │  ┌────────┐  │   ┌──────────────────┐
              └─▶│  Edge  │──┼──▶│ Shape.DoubleEdge │
                 └────────┘  │   └──────────────────┘
                             │   ┌──────────────────┐
                             └──▶│ Shape.ShadowEdge │
└──────────────────┘节点 Node
https://x6.antv.vision/zh/docs/tutorial/basic/node
根据不同的SVG元素来渲染节点和边,x6提供了内置节点和自定义节点
节点属性
节点都有共同的基类 Cell,除了从Cell继承的选项外,还支持以下选项。
| 属性名 | 类型 | 默认值 | 描述 |
|---|---|---|---|
| x | Number | 0 | 节点位置 x 坐标,单位为 'px'。 |
| y | Number | 0 | 节点位置 y 坐标,单位为 'px'。 |
| width | Number | 1 | 节点宽度,单位为 'px'。 |
| height | Number | 1 | 节点高度,单位为 'px'。 |
| angle | Number | 0 | 节点旋转角度。 |
添加节点
const rect = graph.addNode({
  shape: 'rect', // 指定使用何种图形,默认值为 'rect'
  x: 100,
  y: 200,
  width: 80,
  height: 40,
  angle: 30,
  attrs: {
    body: {
      fill: 'blue',
    },
    label: {
      text: 'Hello',
      fill: 'white',
    },
  },
})内置节点
https://x6.antv.vision/zh/examples/gallery/#category-%E5%86%85%E7%BD%AE%E8%8A%82%E7%82%B9
内置节点与svg标签
| 构造函数 | shape 名称 | svg 标签 | 描述 |
|---|---|---|---|
| Shape.Rect | rect | rect | 矩形 |
| Shape.Circle | circle | circle | 圆形 |
| Shape.Ellipse | ellipse | ellipse | 椭圆 |
| Shape.Polygon | polygon | polygon | 多边形 |
| Shape.Path | path | path | 路径 |
| Shape.Image | image | image | 图片 |
| Shape.HTML | html | -- | HTML 节点,使用 foreignObject 渲染 HTML 片段 |
| Shape.... | ... | ... | ... |
自定义节点
https://x6.antv.vision/zh/docs/tutorial/intermediate/custom-node/#gatsby-focus-wrapper
我们可以通过 markup 和 attrs 来定制节点的形状和样式,markup 可以类比 HTML,attrs 类比 CSS。
1、注册
// 自定义节点的名称
export const GAS_SHAPE_NAME = 'gas-shape'

// 对象节点
Graph.registerNode(
    GAS_SHAPE_NAME,
    {
        ...customNodeOptions,
    },
    true // 重名时是否覆盖
)配置解析
// 自定义对象节点的配置,需要展示更多的节点内容在这里去添加,并更新数据
// https://x6.antv.vision/zh/docs/tutorial/intermediate/custom-node
export const customNodeOptions = {
    // 来指定继承的基类
    inherit: 'rect',
    width: 64,
    height: 105,
    // 标签及选择器
    markup: [
        {
            tagName: 'rect',
            selector: 'body',
        },
        {
            tagName: 'image',
            selector: 'image',
        },
        {
            tagName: 'text', // 标签名称
            selector: 'diagramName', // 选择器
        },
    ],
    // 属性设置
    attrs: {
        body: {
            stroke: 'transparent',
            fill: 'transparent',
        },
        image: {
            width: 64,
            height: 64,
            refX: 0,
            y: 10, // 向下偏移 10px
        },
        diagramName: {
            width: 64,
            refX: 32,
            refY: '100%', // 右下角
            textAnchor: 'middle',
            textVerticalAnchor: 'bottom',
            fontSize: 14,
            fill: '#009CFF',
        },
    },
    // 链接桩配置
    ports: { ...ports },
}标签结构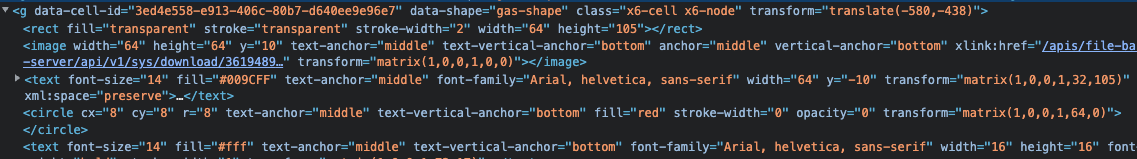
2、使用
const newNode = graph.createNode({
    shape: GAS_SHAPE_NAME,
   	attrs: {},
    data: {},
})修改节点
- node.attr(path, value),详细使用见 attr。
// 修改节点属性
node.attr('selector/attr', value)
// 修改携带数据
node.setData({ ...data })
// 获取携带数据
node.getData()边Edge
https://x6.antv.antgroup.com/tutorial/basic/edge
内置节点节点和边都有共同的基类 Cell, 并继承Cell 的属性
边的属性
| 属性名 | 类型 | 默认值 | 描述 |
|---|---|---|---|
| source | TerminalData | - | 源节点或起始点。 |
| target | TerminalData | - | 目标节点或目标点。 |
| vertices | Point.PointLike[] | - | 路径点。 |
| router | RouterData | - | 路由。 |
| connector | ConnectorData | - | 连接器。 |
| labels | Label[] | - | 标签。 |
| defaultLabel | Label | 默认标签 | 默认标签。 |
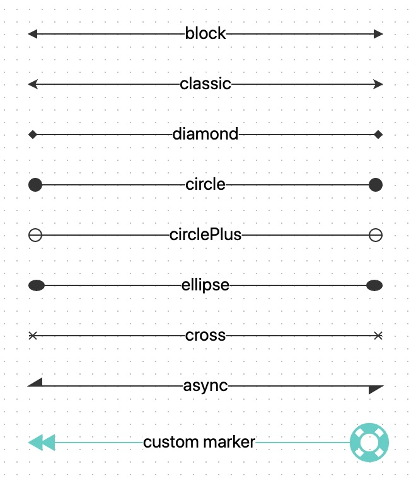
箭头marker样式
节点间连线
链接桩
https://x6.antv.vision/zh/docs/tutorial/basic/port/
负责连线的输入与输出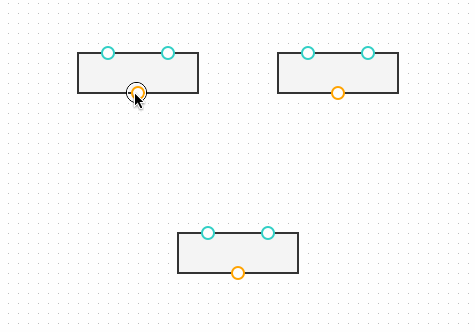
添加
graph.addNode({
    x: 60,
    y: 60,
    width: 160,
    height: 80,
    label: 'Rect With Ports',
    ports: [
        { id: 'port1' },
        { id: 'port2' },
        { id: 'port3' },
    ],
})

// 分组添加
graph.addNode({
    x: 60,
    y: 60,
    width: 160,
    height: 80,
    label: 'Rect With Ports',
    groups: {
        top: {
            // 定义连接柱的位置,如果不配置,将显示为默认样式
            position: 'top',
            // 定义连接柱的样式
            attrs: {
                circle: {
                    ...portStyle,
                },
            },
        },
    },
  	// 链接桩组定义
    items: [
        {
            group: 'top',
        },
        {
            group: 'right',
        },
        {
            group: 'bottom',
        },
        {
            group: 'left',
        },
    ],  // 链接桩
})动态添加链接桩
通过鼠标位置,以及当前节点位置,计算链接桩位置
1、计算链接桩位置
// 双击添加链接桩
graph.on('node:dblclick', e => {
    const { e: event, node } = e
    // 当前选中元素
    const $select = document.querySelector('.x6-node-selected > rect')
    if (!$select) {
        return
    }
    // 用于获得页面中某个元素的左,上,右和下分别相对浏览器视窗的位置
    const position = $select.getBoundingClientRect && $select.getBoundingClientRect()
    if (!position) {
        return
    }

    // 鼠标位置
    const pageX = event.pageX
    const pageY = event.pageY
    // graph.zoom() 缩放层级
    const zoom = graph.zoom()
    // 相对节点左上角的位置/鼠标的位置-元素的位置就是相对位置
    const x = (pageX - position.x) / zoom
    const y = (pageY - position.y) / zoom
    node.addPort({
        group: 'absolute',
        args: {
            // 传递给自定义连接算法的参数
            // 通过鼠标位置,以及当前节点位置,计算链接桩位置
            x: Math.round(x),
            y: Math.round(y),
        },
        silent: false, // 为 true 时不触发 'change:ports' 事件和画布重绘。
    })
})2、添加链接桩
// 鼠标位置 - 元素位置 = 鼠标相对于节点的位置
node.addPort({
    group: 'absolute',
    args: {
        // 传递给自定义连接算法的参数
        // 通过鼠标位置,以及当前节点位置,计算链接桩位置
        x: Math.round(x),
        y: Math.round(y),
    },
    silent: false, // 为 true 时不触发 'change:ports' 事件和画布重绘。
})连线规则
https://x6.antv.vision/zh/docs/tutorial/basic/interacting/#%E8%BF%9E%E7%BA%BF%E8%A7%84%E5%88%99
定制节点和边的交互行为
interacting
// 定制节点和边的交互行为 ==> boolean 节点或边是否可交互
interacting: check
? {
      nodeMovable: false,
      edgeMovable: false,
      magnetConnectable: false, // 是否触发连线交互
      vertexDeletable: false, // 边的路径点是否可以被删除
  }
: true对连线过程进行控制
connecting
 // 连线规则
{
    connecting: {
        // 路由类型
        router: {
            // 连线类型在此修改
            // 曼哈顿路由 'manhattan' 路由是正交路由 'orth' 的智能版本,该路由由水平或垂直的正交线段组成,并自动避开路径上的其他节点(障碍)。
            name: 'manhattan',
                args: {
                padding: 1,
            },
        },
        // 圆角连接器,将起点、路由点、终点通过直线按顺序连接,并在线段连接处通过圆弧连接(倒圆角)。
        connector: {
            name: 'rounded',
                args: {
                radius: 8,
            },
        },
        anchor: 'center',
        connectionPoint: 'anchor',
        // 是否允许连接到画布空白位置的点,默认为 true。
        allowBlank: false,
        // 距离节点或者连接桩 50px 时会触发自动吸附
        snap: {
            radius: 20,
        },
        // 拽出新的边
        createEdge() {
            return new Shape.Edge({
                markup: [
                    {
                        tagName: 'path',
                        selector: 'stroke',
                    },
                    {
                        tagName: 'path',
                        selector: 'fill',
                    },
                ],
                connector: { name: 'rounded' },
                attrs: {
                    fill: {
                        class: 'pipe-ant-line',
                        fill: 'none',
                        connection: true,
                        strokeDasharray: 25,
                        strokeWidth: 3,
                        strokeLinecap: 'round',
                        style: {
                            animation: 'ant-line 30s infinite linear',
                        },
                        // 渐变使用教程:https://x6.antv.vision/zh/docs/api/registry/attr#fill
                        // ??无法垂直渐变
                        /**
                         * 当y1和y2相等,而x1和x2不同时,可创建水平渐变
                         * 当x1和x2相等,而y1和y2不同时,可创建垂直渐变
                         * 当x1和x2不同,且y1和y2不同时,可创建角形渐变
                         */
                        // attrs: { x1: 0, y1: 0, x2: 0, y2: 1, },
                        stroke: '#fff',
                    },
                    stroke: {
                        fill: 'none',
                        connection: true,
                        strokeWidth: 6,
                        strokeLinecap: 'round',
                        stroke: '#8CF7C3',
                    },
                },
                zIndex: 0,
            })
        },
        validateConnection({ targetMagnet }) {
            return !!targetMagnet
        },
    },
}指定触发某种交互时的高亮样式
highlighting
- 'default' 默认高亮选项,当以下几种高亮配置缺省时被使用。
- 'embedding' 拖动节点进行嵌入操作过程中,节点可以被嵌入时被使用。
- 'nodeAvailable' 连线过程中,节点可以被链接时被使用。
- 'magnetAvailable' 连线过程中,链接桩可以被链接时被使用。
- 'magnetAdsorbed' 连线过程中,自动吸附到链接桩时被使用。
{
    // 高亮样式
    highlighting: {
        // 连线过程中,自动吸附到链接桩时被使用。
        magnetAdsorbed: {
            name: 'stroke',
                args: {
                attrs: {
                    width: 12,
                        r: 6,
                        magnet: true,
                        stroke: '#008CFF',
                        strokeWidth: 2,
                        fill: '#0F67FF',
                },
            },
        },
    },
}关于2.0
https://x6.antv.antgroup.com/tutorial/about
2.0 重新设计和实现了渲染架构
图编辑器实现
画布初始化
新建画布
let graph = new Graph(graphOptions())配置解析
/**
 * @desc 初始化面板配置
 * @param check 查看模式
 */
const graphOptions = (check = false) => {
    return {
        container: document.getElementById('gasDiagramPanel'),
        // 定制节点和边的交互行为 ==> boolean 节点或边是否可交互
        interacting: check
            ? {
                nodeMovable: false,
                edgeMovable: false,
                magnetConnectable: false,
                vertexDeletable: false,
            }
            : true,
        // 对齐线
        snapline: true,
        // 撤销/重做
        history: !check,
        // 点选/框选
        selecting: {
            enabled: true,
            multiple: !check, // 多选【开启】
            rubberband: false, // 启用框选【关闭】
        },
        // 显示网格 // 'dot' | 'fixedDot' | 'mesh'
        grid: {
            visible: !check,
            size: 20, // 网格大小
            type: 'mesh',
            args: {
                color: '#e9e9e9',
                thickness: 2, // 网格线宽度/网格点大小
            },
        },
        // 滚动
        scroller: {
            enabled: true,
            pageVisible: false, // 是否分页
            pageBreak: false,
            pannable: true, // 是否平移
        },
        // 滚轮缩放 MouseWheel
        mousewheel: {
            enabled: true,
            zoomAtMousePosition: true,
            modifiers: ['ctrl', 'meta'],
            maxScale: 3,
            minScale: 0.3,
        },
        resizing: false, // 不能修改大小
        rotating: false, // 不能旋转
        keyboard: !check, // 按键操作
        clipboard: !check, // 剪切板
        autoResize: true,
        onToolItemCreated({ tool }) {
            const options = tool.options
            if (options && options.index % 2 === 1) {
                tool.setAttrs({ fill: 'red' })
            }
        },
        // 连线规则
        connecting: {
            ...
        },
        // 连线高亮
        highlighting: {
           ...
        },
    }
}添加节点
通过拖拽交互往画布中添加节点
添加拖拽
https://x6.antv.vision/zh/docs/tutorial/basic/dnd
1、初始化
import { Addon } from '@antv/x6'

const dnd = new Addon.Dnd(options)2、开始拖拽
| 选项 | 类型 | 说明 |
|---|---|---|
| node | Node | 开始拖拽的节点【添加的节点】 |
| e | MouseEvent / JQuery.MouseDownEvent | 鼠标事件 |
dnd.start(newNode, e)<template>
<div
class="flow-library-item"
v-for="group in item.groups"
:key="group.id"
>
<div
class="flow-library-item__img"
:class="'flow-library-item__img--' + group.shape"
:data-name="group.name"
:data-id="group.id"
:data-image="group.image"
:data-shape="group.shape"
:style="{
backgroundImage: `url(${group.image})`,
}"
@mousedown.stop="handleonAddNode"
>
<div class="flow-library-item__name">{{ group.name }}</div>
</div>
</div>
</template>
<script>
export default {
methods: {
/**
* 拖拽并添加节点
* @param e
*/
addNode(e) {
const target = e && e.target.closest('.thumbnail-img') // 匹配特定选择器且离当前元素最近的祖先元素
if (target) {
const id = target.getAttribute('data-id')
const label = target.getAttribute('data-label')
const image = target.getAttribute('data-image')
const newNode = graph.createNode({
shape: 'custom-image',
label,
attrs: {
image: {
'xlink:href': `${image}`,
},
},
data: {
label,
id
}
})
dnd.start(newNode, e)
}
}
}
}
</script>添加节点
先创建后添加
创建并添加到画布
const rect = graph.addNode({
    shape: 'rect', // 指定使用何种图形,默认值为 'rect'
    x: 100,
    y: 200,
    width: 80,
    height: 40,
    angle: 30,
    attrs: {
        body: {
            fill: 'blue',
        },
        label: {
            text: 'Hello',
            fill: 'white',
        },
    },
})推荐第二种,可以通过shape来指定图形类型,包括自定义类型
定制样式
切换编辑器
https://x6.antv.vision/zh/docs/tutorial/intermediate/serialization
完成数据的保存和读取
保存
graph.toJSON()读取
graph.fromJSON()数据与交互
事件系统
https://x6.antv.vision/zh/docs/tutorial/intermediate/events
回调参数包含鼠标位置x、y,事件对象e...
// cell:元素类型,
// click:事件类型,
graph.on('cell:click', ({ e, x, y, cell }) => { })| 事件 | cell 节点/边 | node 节点 | edge 边 | blank 画布空白区域 |
|---|---|---|---|---|
| 单击 | cell:click | node:click | edge:click | blank:click |
| 双击 | cell:dblclick | node:dblclick | edge:dblclick | blank:dblclick |
| 右键 | cell:contextmenu | node:contextmenu | edge:contextmenu | blank:contextmenu |
| 鼠标按下 | cell:mousedown | node:mousedown | edge:mousedown | blank:mousedown |
| 移动鼠标 | cell:mousemove | node:mousemove | edge:mousemove | blank:mousemove |
| 鼠标抬起 | cell:mouseup | node:mouseup | edge:mouseup | blank:mouseup |
| 鼠标滚轮 | cell:mousewheel | node:mousewheel | edge:mousewheel | blank:mousewheel |
| 鼠标进入 | cell:mouseenter | node:mouseenter | edge:mouseenter | graph:mouseenter |
| 鼠标离开 | cell:mouseleave | node:mouseleave | edge:mouseleave | graph:mouseleave |
获取数据
node.getData()设置数据
node.setData({
    ...data
})修改节点属性
// selector:选择器
// attr:属性
// value:修改值
node.attr('selector/attr', value)线的拖拽
//  https://x6.antv.vision/zh/docs/tutorial/intermediate/tools
// 1、vertices 路径点工具,在路径点位置渲染一个小圆点,
// 拖动小圆点修改路径点位置,双击小圆点删除路径点,在边上单击添加路径点。
// 2、segments 线段工具。在边的每条线段的中心渲染一个工具条,可以拖动工具条调整线段两端的路径点的位置。

// 基类 Cell
graph.on('cell:mouseenter', ({ cell, node }) => {
    if (!cell.isNode()) {
        cell.addTools([
            'vertices',
            'segments',
            // {
            //     name: 'button-remove',
            //     args: {
            //         x: '30%',
            //         y: '50%',
            //     },
            // },
        ])
    }
})画布销毁
graph.dispose()查看模式
禁用以下操作,保留点击查看的交互
new Graph({
    // 定制节点和边的交互行为 ==> boolean 节点或边是否可交互
    interacting: !check,
    // 撤销/重做
    history: !check,
    // 点选/框选
    selecting: {
        enabled: true,
        multiple: !check, // 多选【开启】
        rubberband: false, // 启用框选【关闭】
    },
    keyboard: !check, // 按键操作
    clipboard: !check, // 剪切板
})画布缩放及居中
监听页面resize,动态修改画布大小,并居中画布
记得移除监听
mounted(){
  window.removeEventListener('resize', this.autoResize, false)
},
methods: {
  // 容器大小适配浏览器缩放/防抖一下
  autoResize: debounce(() => {
    const gasContainer = document.querySelector('.gas-diagram-container')
    if (gasContainer && graph) {
      // 画布适配 https://x6.antv.vision/zh/docs/api/graph/transform/#resize
      graph.resize(gasContainer.clientWidth, gasContainer.clientHeight)
    }
  }, 300),
}画布居中
// 画布居中
graph.centerContent()节点缩放
缩放设置
resizing: {
    enabled: true,
    minWidth: 64, // 最小宽
    maxWidth: 64 * 2, // 最大宽
    minHeight: 105 / 2, // 最小高
    maxHeight: 105 * 2, // 最大高
    orthogonal: true, // 是否显示中间调整点,默认为 true
    restricted: false, // 调整大小边界是否可以超出画布边缘
    preserveAspectRatio: true, // 调整大小过程中是否保持节点的宽高比例
}节点内容改变
https://x6.antv.vision/zh/docs/tutorial/intermediate/attrs
通过相当大小和位置来替换原有单位,达到节点缩放,内容跟着改变
常用参数:
diagramName: {
    // width: 64,
    // refX: 32,
    refWidth: transformToPercent(64, 64),
    refX: transformToPercent(32, 64),
},...
右键菜单
扩展
Thanks
